Another Wall Street Journal editorial once again confuses a rising year‐to‐year change in a price index with a monthly inflation rate for November. A chart supposedly "shows how wholesale price have risen every month but one this year on an annual basis." This factoid is said to be "a monumental rebuke" to the Fed, which (because of that "annual basis" trickery) is effectively blamed for both falling prices during COVID waves as well as rising prices during reopenings.
The charted year‐to‐year changes in the PPI do not show that producer prices "have risen every month," but that they have risen relative to the same months in the frequently deflated year of 2020 (which are artfully concealed).
The Journal's chart shows an untested decade‐old Producer Price Index (PPI) designed to separate "final demand" from intermediate stages. Unlike traditional PPIs for goods ("commodities") this index bravely tries to track prices for about 72% of private services, including retail and wholesale trade.
I have written more than enough about what is wrong with using year‐to‐year changes to approximate recent price trends, but at least one important component of this PPI "inflation" provides a particularly disturbing (or perhaps amusing) example.
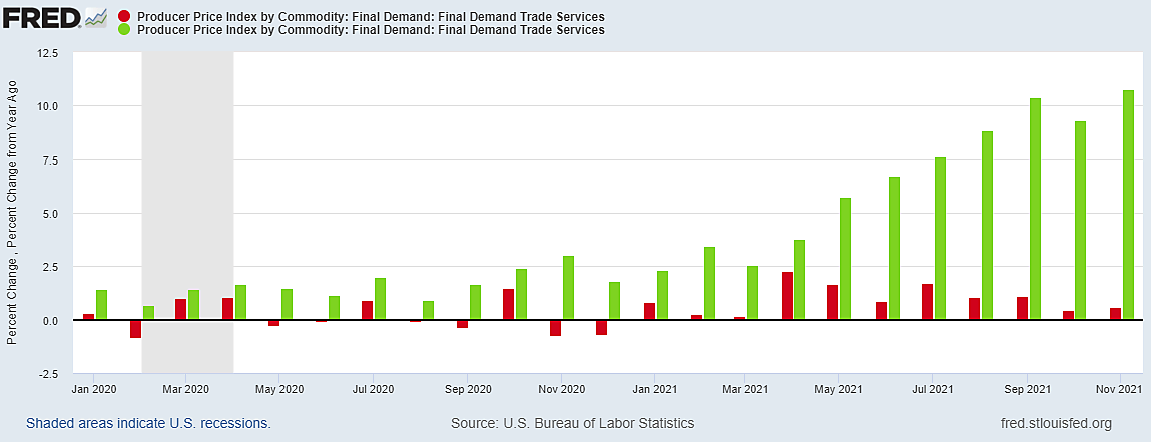
The graph shows Final Demand [for] Trade Services, meaning wholesale and retail trade. "With the [Final Demand index] expansion that includes prices for many services," notes the Bureau of Labor Statistics, "it has been observed that the indexes for wholesale and retail trade, which measure changes in margins, also are subject to potentially large short‐term changes in prices." The sellers' market in new and used cars, for example, raised profit margins for car dealers (on very few cars sold) which show up as big increases in the PPI for trade services.
The red bars shows that short‐term increases in the PPI for trade services have nonetheless slowed in the past four months, not risen. Yet the green bars show the notorious year‐to‐year increase rising as the monthly increases slowed. Why?
Did the Federal Reserve drive the green bars higher?
No, the year‐to‐year improvement in profit margins is because retailers and wholesalers had a terrible year in 2020, with estimated "prices" (profit margins) falling in six of last eight months of the year – notably in November and December. Do rising producer prices in trade mean higher costs are impinging on sellers' profit margins? On the contrary, higher prices in commercial trade are defined by the BLS as better profit margins, turning good news into bad.