Politics aside, there's a simple reason why the Federal Open Market Committee (FOMC) shouldn't have raised rates so high – it's not nice to fight mother nature.
The FOMC describes how their decisions are made based on several guide-posts. To know whether the Federal Funds (FF) rate is too high or low, it can be compared to the "natural" or "neutral" interest rate.
- The natural interest rate is the interest rate that would be naturally in the market in absence of short-term disruptions, such as liquidity crunches or rising commodity prices
- This is also viewed as a neutral rate that balances the supply and demand for funds without causing whacky impacts on the price level
- For more twists of natural/neutral rate history, see "To better forecast the Fed, better learn natural rates."
The FOMC's complication is that their models — primarily based on the gap between actual and potential Gross Domestic Product (GDP) — have wide error ranges because of the assumptions involved.
A better guide-post for the natural rate would be a measure
that is easily observable, less noisy, lower risk, liquid, and global.
Measures that meet the need nicely are investment grade
corporate bond yields. Conveniently, Moody's provides nearly a century of data.
Across 37 years, the trend is lower yields. The down-trend started in 1981 with the little-known story of how more than interest rates broke inflation.
- The downtrend from 1987 to 2016 is nicely consistent
- That consistent trend is precisely what makes a good guide-post for "natural" behavior

More, yields have fallen for the full range of seasoned
investment grade bonds (Moody's Aaa to Baa) and for corresponding U.S.
Treasuries.
They've been falling in real and nominal terms.
They've fallen even after the Personal Consumption
Expenditures (PCE) price deflator excluding food and energy went roughly flat
20 years ago.

Yet, that downward trend slowed in fall 2012, about the beginning of the third round of large-scale asset purchases (a.k.a., Quantitative
Easing, or QE). Yields rose in fall 2016, about the time that the Federal Funds
(FF) rate began its ongoing increases. Then, yields fell before rising again at
the beginning of 2018. More, the ratio of Moody's
Aaa yield to the FF rate is high compared to much of history.
Don't fight the natural flow of markets
Zooming in on just the post-crash trend, consider the
perspective of a trader with a simple technical chart. Her chart reveals yields that are quite high, especially
for the Baa bonds at the bottom of investment grade. As seen in daily news, this has caused churn for people – both for traders like her and portfolio
planners.

If the Aaa yield were on its 30-year trend from 1986-2016, then
today it would be about 100 basis points (bps) lower. If it were on its trend
since 2009, it would be about 50 bps lower. The Baa yield would also be lower. Regardless of preferred trending math, lower
yields are suggested.
It's simple, the
multi-decade trend looks natural to be supported, not fought.
To better understand and then support the trend, the FOMC
could:
- Stop raising the FF rate, in fall 2015
we encouraged the FOMC to take a "cap and lift" approach.
- Allow the dust to settle and gain clarity
- Determine why the falling yield trend slowed in
2012 and why in 2018 yields on 20+ year bonds reacted so strongly to an
increase in super-short overnight rates. Market opinion is fuzzy, too many
opinions are based on partial information, and there are several inter-related
causes. In addition to QE3 in 2012 and FF rates in 2016, there is also the
flattening of the ratio of Total Financial Assets (TFA) to Gross Domestic
Product (GDP) in 2007 (more below) and Dodd-Frank regulation.
- Determine how much of price level change is due
to monetary policy causes, compared to causes from business, tech, trade,
shoppers, and government taxing, spending and
regulatory policy
- Communicate with markets using direct financial
market and corporate data used for business decisions
These are all needed
because driving the FF rate to arrive safely at the
desired bond yield is like driving a car on an icy road – survival
requires knowing how your car behaves on the ice
and a skilled touch.
"Follow the yields" is simple. But it is not central bank core doctrine. Summarizing views, there seem to be at least four reasons…
First, central banks and financial markets have different ways of searching for natural trends
- Central banks use "output gap" based models to predict the direction of interest rates based on the difference between potential and actual GDP. Today, those models are outdated because they overlook decades of global transformation in technology, management technique, and trade that have reshaped production of goods and services, and financial markets.
- Financial markets focus primarily on yields created by supply and demand of funds. Flows are shaped by everything from corporate fundamentals to foreign exchange rates to political decisions. Pleasing to central banks, the demand for bonds brings in a production emphasis, yet shaped by realities of tech and trade.
- Think of the disconnect in football terms. Central bankers are predicting what's happening now in a football game based on pre-game talk shows and stats. Market people are watching the game, if not playing in the game. Central bankers don't need to stress so much about predictions if they track the more natural trends.
Second, "inflation" and policy rates don't track as nicely
as theory assumes. Below, both are shown, along with wide swings in their
ratio.

Third, FF rate to bond yield relationships aren't as simple as theory assumes, even with differences in credit risk and duration. As we've written before, it's time to retire "rules of thumb," such as between the FF rate and the 10-Year U.S. Treasury.
Fourth, central banks mostly assume they are not the cause
of instability. FOMC members hoped that their actions would be like "watching
paint dry." Yet, media stories feature market speculation about FOMC decisions.
- Making it worse are that the FOMC and markets use different communication touch-points and the FOMC has periods where public communications are blacked-out
- Some FOMC members look at break-evens on Treasury Inflation-Protected Securities (TIPS) as though they are a thoughtful analysis of "inflation." Instead, TIPS break-evens are more about trader speculation on FOMC actions – creating a circular guessing game.
The FOMC needs a
classic half-time speech. The other team – people around the world in today's global
tech and trade economy — has too many new plays that demolish the FOMC's traditional
playbook.
Central banks seem to struggle to update for two deeper
reasons
First, central banks seek policy rates above 5%, because
when problems arise, cutting
500 basis points is the "only play in the
book." Central banks haven't had a sufficient "rethink" of their capability to act in the face of forces from technology, global markets creating more
ways to escape national central bank policy, global trade, and policies from governments
around the globe.
Second, distinct causes of price level increase are rarely
discussed.
- Health care policy, financial regulation, higher
education tuition and lending policy, and
housing policy (from local regulation to financing), tax increases, subsidies, tariffs,
and other regulation show that much of the increase in the PCE deflator is
really government-driven "policy inflation" – nothing to do with monetary
policy
- Technology, management technique, global trade,
and shopper preferences have all tended to cut costs and prices – globally
tradeable goods and services have been in "deflation" since the mid-1990s
- In data, it is difficult to find clear monetary-caused
inflation beyond the central bank-driven portion of foreign exchange rates
In short, many central
bank struggles seem to flow from underestimating
the influence of the global tech and trade transformation – like
underestimating the ability of an opposing football team to create and execute
new plays.
Football fans – in what year did Lawrence Taylor – who redefined the outside linebacker role – join the NFL? 1981! That's also how long yields have been falling. How much has changed in football playbooks? How much has changed in central bank playbooks? Hmm.
Previously,
we've analyzed this both in terms of tangible products and financial markets.
Below are two financial market views.
First, since 1981 businesses
have been generally borrowing more while bond yields fell – more than
sufficient assets flowed into lending.

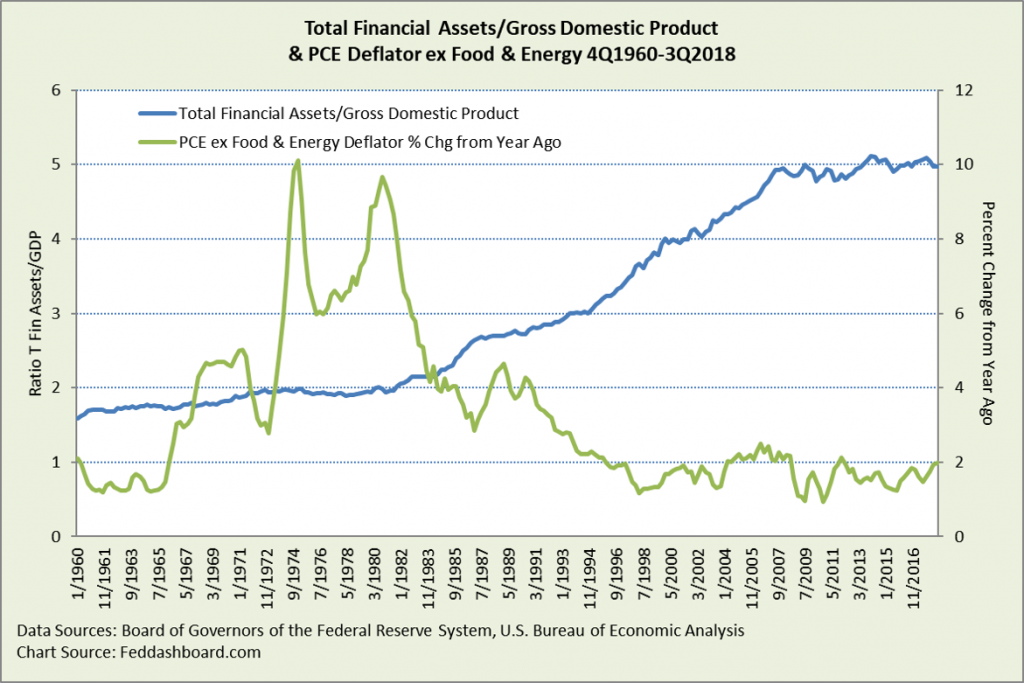
Second, the TFA/GDP
ratio has been generally increasing while price levels have been decreasing.
This helps explain why QE did not create massive inflation. The TFA/GDP ratio
is also another view of the natural interest rate because of how it reflects
financial assets available to fund GDP growth. The TFA/GDP ratio flattened starting in 2007 mostly because of financial
asset growth slowing in the: Domestic Financial Sector, Rest of the World flows
into the U.S., and State and Local Government.
Together, these
suggest a case for simplifying — stopping FF rate increases, studying the dynamics,
supporting the natural trend, and expanding the monetary policy "rethink."
Data Geek Notes:
- "Seasoned bonds" as reported by
Moody's are bonds with maturities of 20 years and above
- "Effective" Federal Funds rate refers to the
actual daily rate between the upper and lower boundaries set by the FOMC
- Real Total Liabilities (TL) and Baa yield are calculated
with the PCE deflator excluding food and energy
- Baa yields are shown in the chart because TL
includes all borrowing and Baa bonds are the lowest investment grade; of
course, lending and rates vary by credit quality, loan purpose, and funding
source