For accelerating on an expressway or powering through off-road terrain, a driver must shift gears. To get to higher growth, it's time for the Bank of Japan (BOJ) to shift gears.
- The BOJ has been in "low gear" to "get traction" with "quantitative easing" (QE)
- The BOJ has achieved its objectives: massive liquidity, growth in household consumption and compensation of employees, and price stability
- Success means it is time to shift from low gear QE to a higher gear to cruise down the expressway toward healthier households and exports
In consumption and compensation…
In the data picture below and in more detail in prior analyses, prices have been very stable (R-squared .85, it's even more stable excluding energy, Global Financial Crisis (GFC), and the Value-Added Tax (VAT) increase).
Better, the strength of Japan's innovation has cut product cost, reduced scarcity, created abundance, and grown exports vital to an island nation.
Shoppers buy more when prices fall. Rising prices are a threat to purchases.
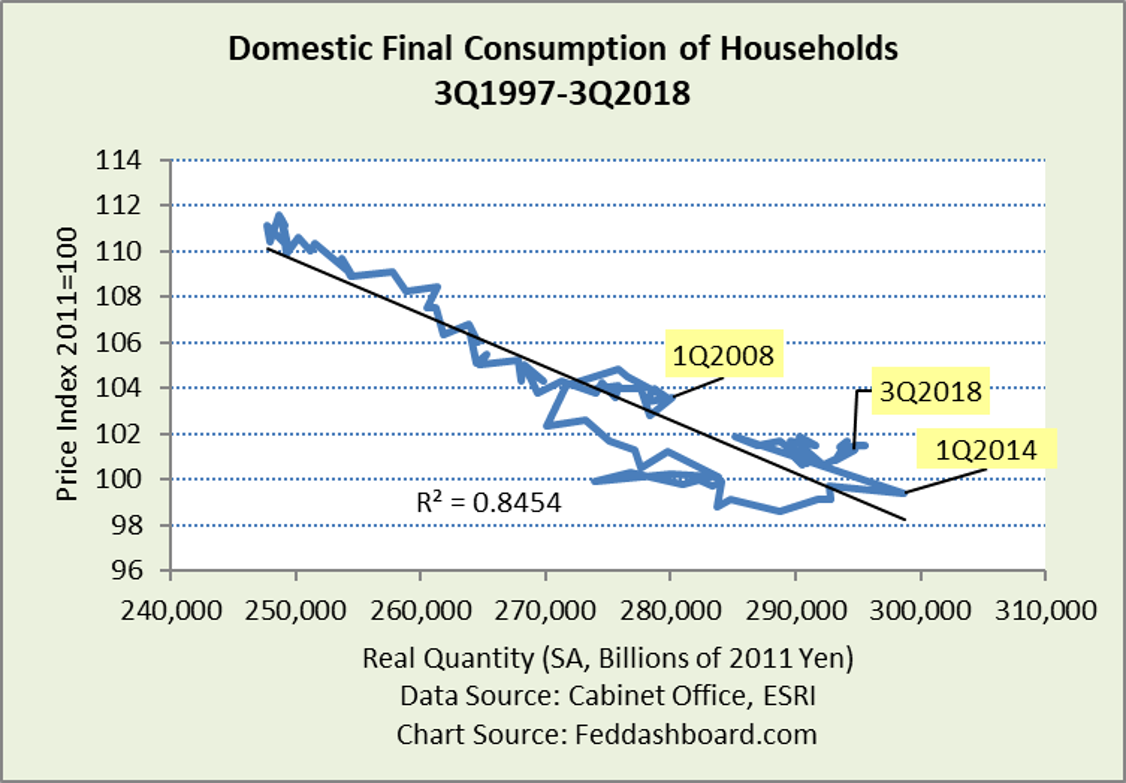 Demand has grown steadily although constrained by demographics and energy conservation and hurt by the GFC and VAT increase.
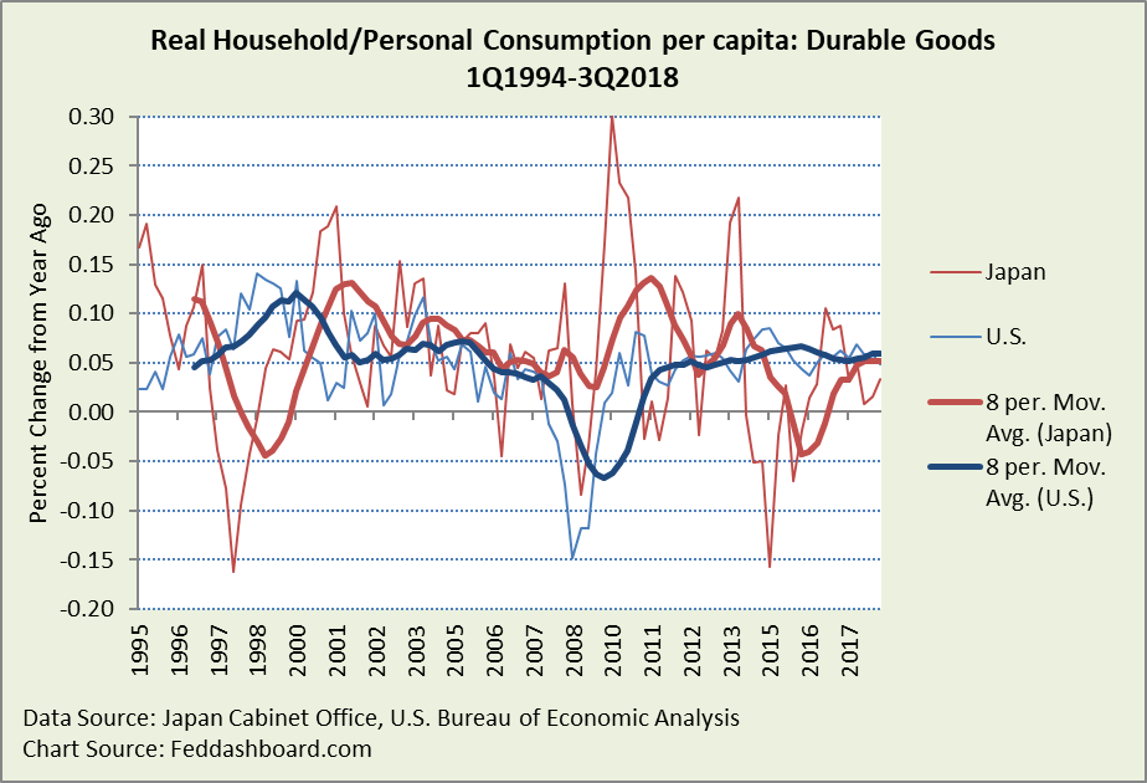
To filter out the demographics and energy conservation, and feel the pulse of demand, it helps to focus on the most sensitive aspect of consumption, durable goods.
The average Japanese shopper of durables has generally been stronger than the average U.S. shopper – even stronger considering Japanese households generally reduced debt, whereas U.S. shoppers increased debt. The drop in 2014 was mostly self-inflicted due to the VAT increase.
Real (price-level-adjusted) Compensation of Employees (CoE) for all employees since 2015 echoes strength from before the "Asian Flu."
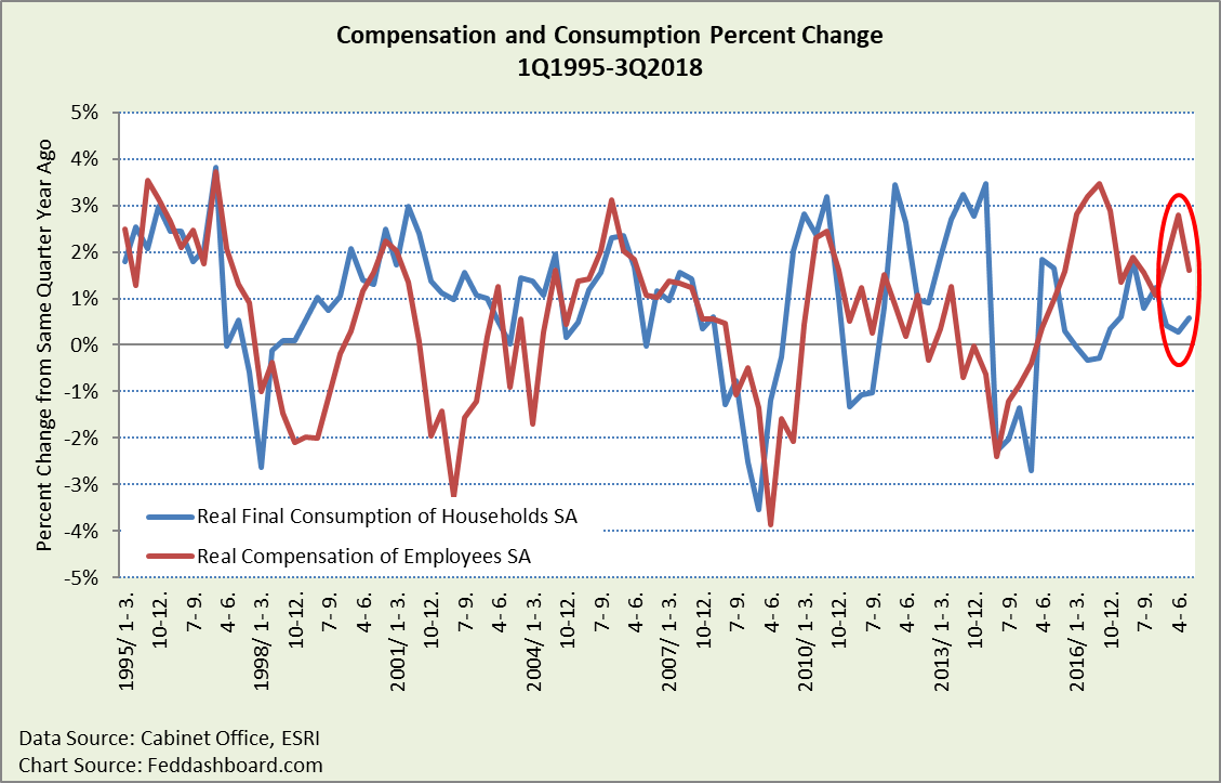 In an aging population, increased savings (compensation greater than consumption) is good, not bad.
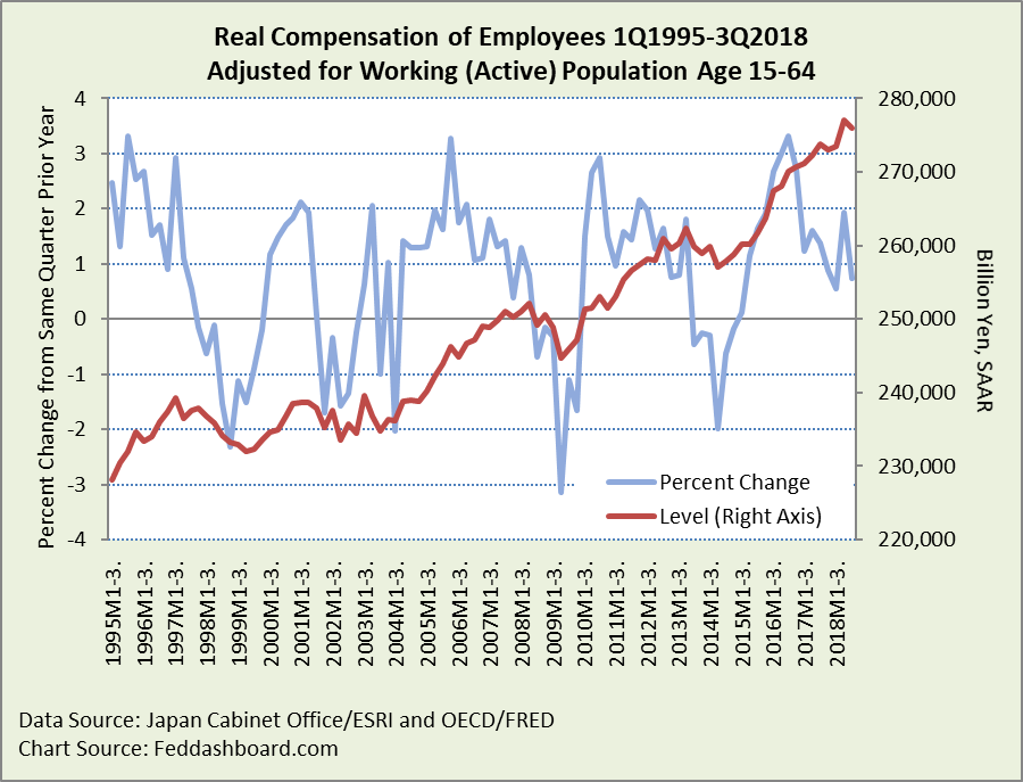
CoE per economically active (working) person has been growing for over a decade. Growth started late 2004 with dips in 2009 and 2014. This growth is in stark contrast to the relatively flat prior decade, 1994-2004.
 Notes:
- Growth rates (blue line) in 2018 are lower than previously reported by the Economic and Social Research Institute (ESRI) due to upward revisions in 2017. The level (red line) provides context.
- Growth rates are lower since 4Q2015 than in the prior chart because economically active persons have been growing since 4Q2015
Also contributing to weaker 2018 growth rates has been weaknesses in total cash earnings growth in Medical, Health Care and Welfare industries. As industries have their own stories, it helps to look more closely at the growth spurt beginning 2014 (including the rebound from the April 2014 VAT increase). This view reveals that the strongest wage growth has been in the Wholesale and Retail Trade industries.
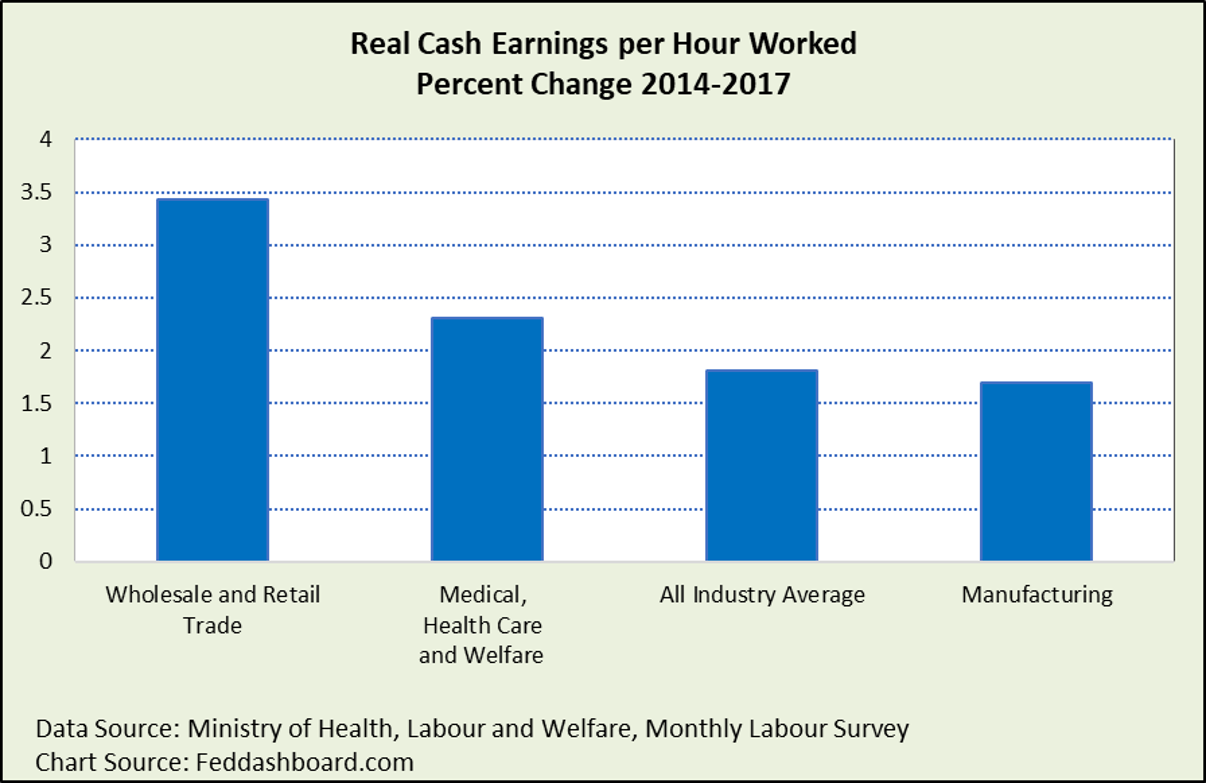 That wage growth is least in Manufacturing is no surprise as the increasing capability of automation (such as mobility of robots) and falling costs of automation restrain wages of "service humans" assisting automated equipment.
Zooming out to the bigger picture, to look at only consumption, product costs, and compensation would neglect the wisdom of general equilibrium. In addition, money balances, funds flows, and foreign exchange (FX) rates can guide our understanding of prices.
Turning to financial flows…
- As in the U.S., if price level change was primarily about "too much money chasing too few goods," then prices would have risen as Total Financial Assets (TFA) exploded to 15x from 10x of Gross Domestic Product (GDP)
- BOJ total assets are 6.7% of total financial assets, rising from 2.7% in 2013. Yet, BOJ assets are less than Japanese assets held overseas of 8% that rose from 3.3% in 2003.
- Quantitative Easing (QE) policy overlooked past influences of product costs and financial markets on price levels
- The success of Toyota and other manufacturers, especially exporters, in reducing product costs and improving quality is a driver of lower prices that have benefited global shoppers
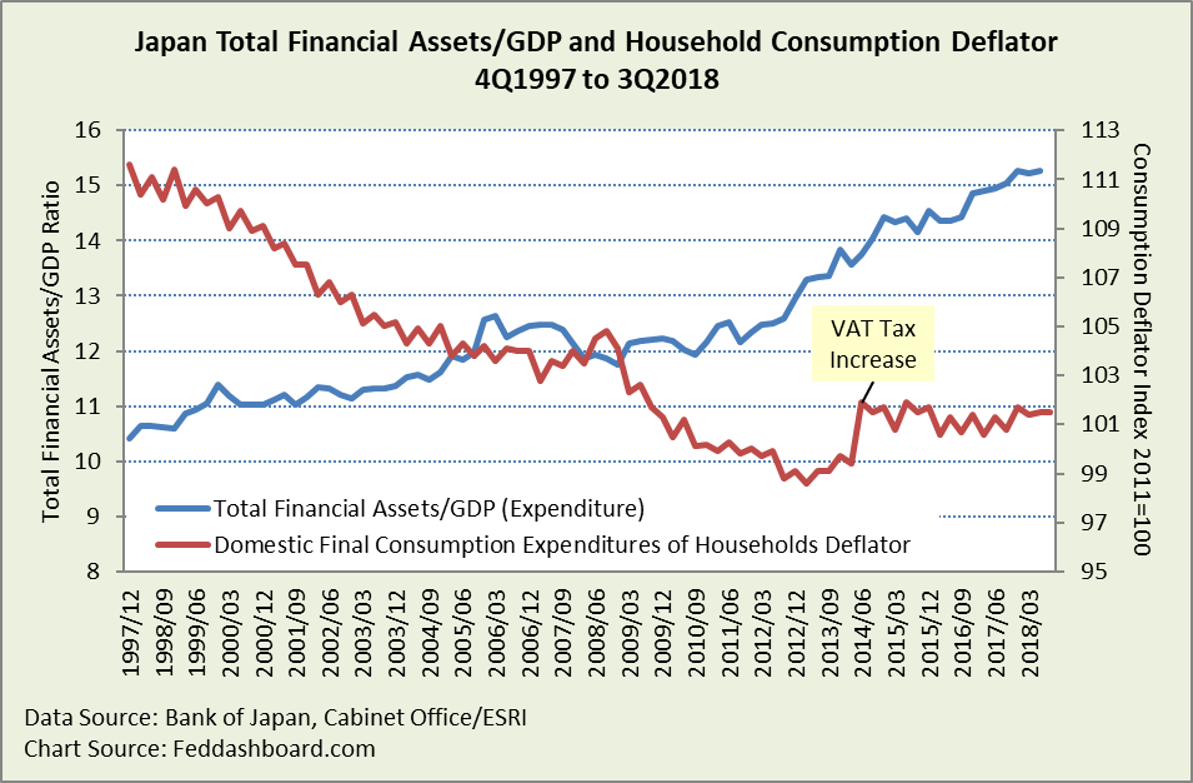 Note: ESRI data to 3Q2018, BOJ data to 2Q2018
Historically high TFA/GDP plus increasingly globalized financial markets suggests Japan's natural/neutral interest rate is historically low.
"Price stability" success can be defined as minimal monetary-caused distortions to product cost trends. Monetary causes are the domain of a central bank, as opposed to causes beyond the scope of a central bank, such as the technology and management methods that continuously drive lower product costs – sometimes called "policy inflation." "Policy inflation" reflects the regulatory, tax, and spending policies of other government agencies.
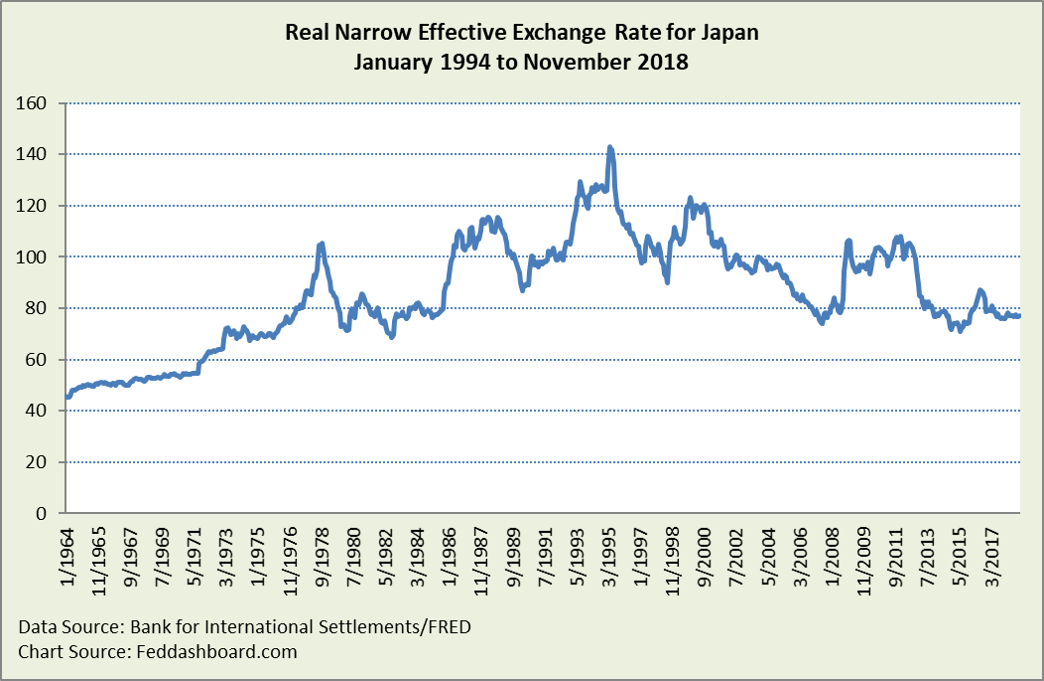
Price level changes due to FX can come from changes in the goods and services trade balance, investment flows due to tangible investment opportunities, or monetary policy.
Japan's exchange rate is historically favorable, about the same as in "Japan, Inc." years in the late 1970s and early 1980s.
 With objectives achieved, QE can end. Declaring success brings more benefits:
- Avoids distortions in financial markets (including FX)
- Communicates to people that the economy is healthier, encouraging marriages and babies, and reducing the fear of higher prices (and hopefully reducing fear of the next VAT increase)
- The BOJ can follow the footsteps of "Japan, Inc." to become a global role model in understanding the economics of exponential technology
Product price changes have been primarily about technology and management (in both product costs and online shopping), rather than weak demand. The Abe Government is aggressively pursuing structural reforms and technology and management improvements that will further cut costs.
Decreasing goods price trends:
- Are similar to those in other industrial countries – not unique to Japan
- Reflect Japan's strengths in technology, management technique, and trade
- Enabled Japan to blossom as a logistics hub in 1955 and then convert relatively expensive import materials into relatively inexpensive and high-quality exports – reflecting Deming Methods, the Toyota Way, and strengths of "Japan, Inc."
- Have been visible in industrial country data since the 1970s, with a tipping point in the mid-1990s
- Are associated with shoppers buying more
Combining data and insights about technology, management, shoppers buying more as prices fall, exports, exchange rates, and money balances adds to the insights brought by Governor Kuroda to the BOJ.
BOJ has opportunities to emphasize:
- Babies – illustrating a healthy economy that encourages marriages and babies
- Innovation – following models of other countries, especially Bank of England, in aligning with other government policy to encourage technologies such as artificial intelligence and FinTech
- Structural reforms to cut cost – coordinating with other government policies
- Exports – reducing distortions in financial markets, with the Bank of England as an example
- Household debt reduction – seeing savings as positive for an aging population
In reading numbers, it's important to realize that Japan's strength has been obscured by not consistently comparing to other countries on a:
- Demographic-adjusted basis
- CPI construction and government program accounting-adjusted basis
- Policy-adjusted basis, especially housing, health care, and education where Japan's policy choices tend to produce less "policy inflation"
- Price deflator-real quantity matched basis, failing to use ESRI's matched data
In short, the BOJ has many opportunities to help Japan grow – it's time to shift gears.
Data Geek Notes:
- In the Monthly Labour Survey, "Cash earnings are the amount before deducting income tax, social insurance premium, trade union dues or purchase price, etc."
- Real Cash Earnings calculated using the Household Final Consumption Deflator from ESRI, rather than CPI, as the deflator is more robust and more similar to the Personal Consumption Expenditures deflator used in the U.S.