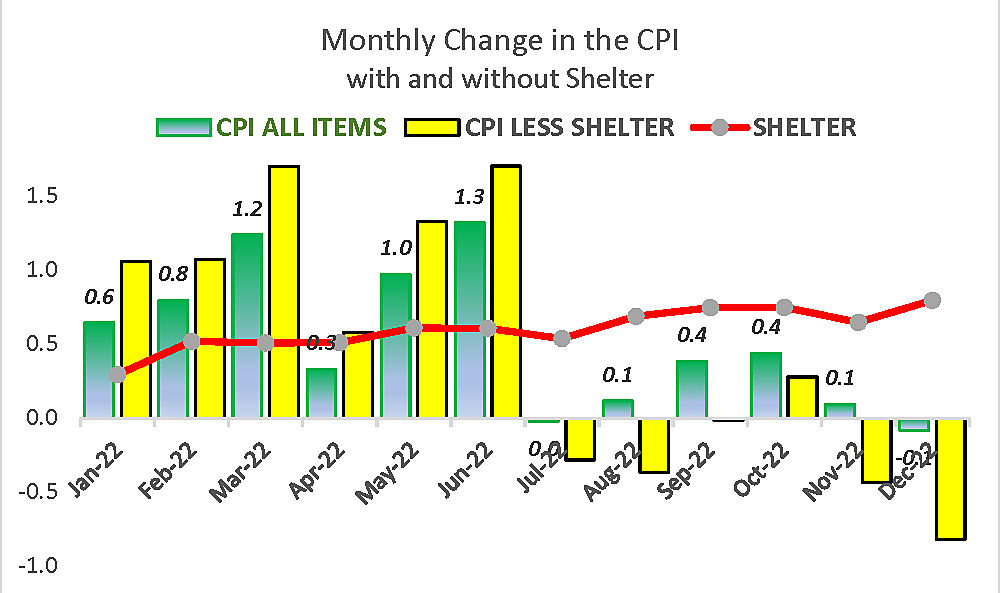
In the first half of 2022, January to June, CPI inflation averaged 0.89% a month (nearly 1%). In the second half, the monthly changes averaged 0.16% (less than two‐tenth of one percent).
Just multiply the average monthly inflation rate times twelve to see that the annual rate of inflation slowed from 10.7% in the first half to 1.9% in the second.
Reducing inflation by 8.8 percentage points for half a year seems worthy of more attention. Instead, top Fed officials and uncritical journalists keep speaking and writing as though the change was barely discernable, merely a slight easing. The reason for that nearly universal misunderstanding is the perennial confusion of year‐to‐year changes (a 12‐month average) with what has been happening recently.
A typical Wall Street Journal report thus sees only “a slightly more optimistic outlook for inflation.” That is because, “as measured by the year over year change… inflation has eased from 9.1% last June to 6.5% in December.”
Similarly, at his December 14 press conference, Chairman Powell said, “In November, the 12‐month change in the CPI was 7.1 percent… The inflation data …for October and November show a welcome reduction in the monthly pace of price increases. But it will take substantially more evidence to give confidence that inflation is on a sustained downward path.” Yet there had been several months of near‐zero inflation by November, with a presumably welcome 2.4% average inflation rate from July to November.
The “downward path” outlined by FOMC projections was for PCE inflation to gradually decline to 3.2% by the fourth quarter of 2023, then 2.5% a year later, and 2.1% by late 2025. Yet CPI inflation has already been well below the 2025 FOMC path for half a year while Fed officials raised their projections of future inflation and future short‐term interest rates (even as 10‐year bond yields fell from 4.3% to 3.4%).
We could add together the 10.7% inflation rate in the first half and the1.9% rate in the second to get 12.6%, then divide by two to find the 12‐month average. Unsurprisingly the 6.3% result is essentially the same as the widely cited 6.4% 12‐month year‐to‐year change for December.
The crucial difference is that by splitting the annual change into two halves we clearly see what happened when.
The reason the 12‐month inflation merely eased from 9.1% to 6.4% from June to December is not because there has been little change since June. It is because that overused 12‐month year‐to‐year average is a deceptive fifty‐fifty mix of very high and very low inflation.
The Federal Reserve Board has 357 economists to make projections and spin rosy scenarios about the future. Yet they seem institutionally reluctant to identify changes in inflation over periods shorter than twelve months. This habitual dependence on year‐to‐year averages prevented the Fed from leaning against very high inflation in the second and third quarters of 2021 because even after several months of 7% inflation the 12‐month average was still comfortably diluted by low inflation during COVID lockdowns. The FOMC did not get serious about raising rates until June of last year when monthly inflation peaked. The same statistical myopia now prevents the Fed from seeing very low inflation in the third and fourth quarters of 2022 because the 12‐month average still looks deceptively high.
The minutes of the December 14 FOMC meeting opened with “staff review” providing assorted inflation estimates only “over the 12 months ending in October.” Similarly, the Fed staff wrote that “Compensation per hour (CPH) in the business sector rose 4.0 percent over the four quarters ending in the third quarter [emphasis added].”
Had the Fed’s staff economist focused on 2022 (rather than padding the data with a high number from 2021) Fed Governors and bank presidents at the meeting would have learned that CPH averaged only 2.6% for the first three quarters of 2022. However, showing last year’s 2.6% compensation figure would have contradicted the Chairman’s latest “wage inflation” justification for high interest rates.
During each of the next six months, another one of those high 0.6–1.3% monthly inflation rates of early 2022 will gradually drop out of the 12‐month average, making the year‐to‐year inflation reports slower and slower as a matter of arithmetic (other things being equal). The only way the Fed‐favored12‐month average could fail to slow in the first half of 2023 would be if future monthly inflation was just as high as high as it was in January–June last year—that is, rising by nearly 1% a month and sometimes higher. Nobody believes that will happen, not even the most enthusiastic cheerleaders for the hawks’ futile, quixotic crusade of trying to push the federal funds rate two percentage points higher than the bond yield.
The Trouble with CPI Rent Estimates
As low as it may seem, the CPI’s 1.9% rate of increase since June was nonetheless seriously exaggerated, overstated by the heavy weight assigned to shelter (the red line in the graph). Shelter accounts for 32.9% of the CPI compared to 7.9% for energy.
Almost a fourth of the shelter price index (7.5% of the CPI) consists of many time‐consuming BLS surveys of rents on old and new leases. The other three‐fourths of shelter (24.2% of the CPI) is a rent‐derived estimate of what owner‐occupied homes might rent for. It is called owner‐equivalent rent, or OER.
Shelter rents and OER supposedly rose at a literally unbelievable 8.4% annual rate in the second half, up from 6.1% in the first. Yet home prices and market rents on new leases have been falling fast. This makes no sense. How could houses and condos that are falling in value possibly command higher and higher “owners’ equivalent” rents? That is doubly incredible since rents on new leases are falling.
The yellow bars show that if shelter were excluded, the other 67% of the consumer price index experienced a 3.2% rate of deflation for the past six months. That does not necessarily imply overall inflation was below zero, since rent and OER increases were wildly exaggerated but not always zero for all six months. What it does suggest, however, is that for the two‐thirds of the CPI that excludes shelter, U.S. inflation has indeed been near zero for six months, on average. Some consumer prices rose, others fell, but the average rise was roughly nil. And a half year is no fluke.
The fatal fault with the ever‐increasing red line for rent (up 8.8% year‐to‐year in December) is that home sales and leases from 2021 that have only recently been reported as shelter inflation are about 12–18 months too late. That long lag between reality and the CPI shelter statistic is well known. It is the reason why Federal Reserve Chairman Jerome Powell has acknowledged that shelter inflation will unquestionably be coming down this year.
Since a November 30 speech deemphasizing lower price inflation measures (such as goods and energy) in favor of wages, Chair Powell has suggested excluding the lagging shelter statistics from CPI services (services less shelter is just 28.5% of the CPI, though he also excluded home electricity and gas services). Powell’s habitual 12‐month averages masked the fact that the inflation rate for “services less shelter” also fell in the second half to 4.1% from 11% (see graph here). If we likewise excluded shelter from the total CPI (the yellow bars in the graph), that leaves a ‑3.1% rate of deflation in the first half, which may be too large a correction.
The Chairman’s theory that prices in hundreds of extremely diverse service industries are being driven up by last year’s 2.6% rate of increase in compensation is beyond the scope of this note. For those interested, however, I have created a relevant Table comparing 12‐month inflation rates with 3‑month inflation for the fourth quarter. It shows the fourth quarter services inflation slowed substantially in most cases.
The Perennial Year‐to‐Year Inflation Confusion
What about energy inflation?
In his Brookings Institution presentation, Chair Powell also spoke only about “core” inflation, which essentially involved ignoring oil and gas prices now that they are much lower than in the first half (food prices had a negligible impact on recent core inflation).
For those like Chairman Powell and the Fed staff who focus exclusively on12‐month inflation rates—never three or six months—this year would be a strange time to stop paying attention to energy prices, notably crude oil.
WTI crude oil averaged $96 a barrel from January to November last year and $103 from February to August. Oil would have to rise to around $100 and stay there to prevent energy from significantly reducing the year‐to‐year inflation headline numbers from January to November of 2023.
I wrote about The Perennial Year‐to‐Year Oil Price Confusion in this space on November 11, 2021. That paper used two graphs to show that “year‐to‐year percentage changes in the CPI (and all other price indexes) invariably go up and down with year‐to‐year percentage changes in the price of oil… Higher oil prices also raise non‐energy costs such as transportation, paint, and plastics, so even core inflation is affected. . . As both graphs show, however, markets are self‐correcting. Past oil price spikes also overstated year‐to‐year inflation statistics, such as the PPI and CPI, but not for long. Oil price spikes always proved transitory because steep energy prices squelch demand and boost supply. Oil prices spikes can also end too abruptly by triggering global recessions—as in 1974, 1979, 1990 and 2008. Recession risk is greater—as Ben Bernanke and others documented in “Systematic Monetary Policy and the Effects of Oil Price Shocks”—if the Fed overreacts to oil‐based distortions in headline inflation by raising interest rates on bank reserves too aggressively… If we do not stop obsessing over widely misunderstood year‐to‐year percentage changes—and rushing to blame someone at home for a global problem—policymakers could easily repeat bad mistakes.” And that is exactly what the Fed is contemplating doing again very soon, by pushing the federal funds and T‑bill rates far above the yield on 10‐year bonds—an inverted yield curve that always end in recession (and excessive Fed rate cuts) unless the funds rate is promptly brought down below the bond yield, as in 2019.
As Paul Krugman recently wrote, “the inflation news is really, really good,” and the Fed’s “attempt to stay pessimistic on inflation is starting to feel a bit desperate.” Disinflation denialists at the Federal Reserve have been getting the fundamental facts about inflation all wrong.
Economist Alan Reynolds is a senior fellow at the Cato Institute and former vice president of the First National Bank of Chicago. He served as research director with Jack Kemp’s 1995–96 Tax Reform Commission and with Larry Kudlow and Alan Greenspan as a member of President Reagan’s 1981 transition team.